
The gold rally most investors missed
By Andrew Russell
Continuing disconnect between gold price and gold equity valuations.
PM Capital’s gold positions contributed significantly to our portfolio’s strong returns in the September 2025 quarter.1
Our key gold position – Newmont Corporation – rallied 45% during the September quarter. Northern Star Resources was up 26% since being added to the portfolio in July 20252. Both stocks benefited from the 17% rise in gold during the quarter.3
Freeport-McMoRan, a key commodity position in our portfolio, also provides significant gold exposure, in addition to its flagship copper operations. Freeport-McMoRan expects to sell 1.05 million ounces of gold in 2025.4
However, after peaking at US$4,381 an ounce in October 2025, gold fell almost 10% by that month’s end5. The precious metal may have run too far, too fast for now, buoyed by excessive investor sentiment.
We continue to view gold equities as an attractive long-term theme, despite likely further short-term gold-price pullbacks and corrections.
Longer-term forces supporting a higher gold price remain intact. They include:
- Sharply higher government deficits and interest payments
- Waning confidence in the US dollar
- Rising geopolitical tensions and uncertainty
- Inflationary pressures due to ‘deglobalisation’ and manufacturing ‘reshoring’ in the US
- The US Federal Reserve signalling US interest rates have peaked
- Greater central bank buying of physical gold, particularly in emerging markets
Moreover, institutional investors continue to be underweight gold equities, judging by fund outflows into major Exchange Traded Funds (ETFs) that invest in global gold miners, as Chart 1 below shows.
The chart suggests more investors have taken profits this year in ETFs that invest in gold equities as the spot gold price has rallied.
As PM Capital has often noted, many investors underestimate the extent and duration of long-term sector recoveries, selling too early into a rally. This might be the case again with gold equities.
Chart 1: Fund outflows from gold miners as gold price rises

Source: FactSet, PM Capital
After two decades of underperformance, gold equities potentially have much ground to make up this decade and beyond. It’s possible the gold equities recovery is still in its early stages.
Our gold thesis
The starting point is distinguishing between gold bullion and gold equities. Media articles about people queuing to buy gold in Sydney’s Martin Place highlight an important point: most investor interest has been in physical gold.6
The US-dollar gold price has almost doubled since 2022, as Chart 2 below shows7. More investors have bought gold as a ‘safe haven’ amid rising geopolitical and global economic uncertainty, fuelled by President Trump.
Persistent higher inflation – a trend PM Capital foreshadowed8 – adds to gold’s appeal as a store of value. A weaker US dollar, greater central-bank buying of gold and rising sentiment towards gold have supported its price.
Chart 2: Gold price rally (USD/oz)
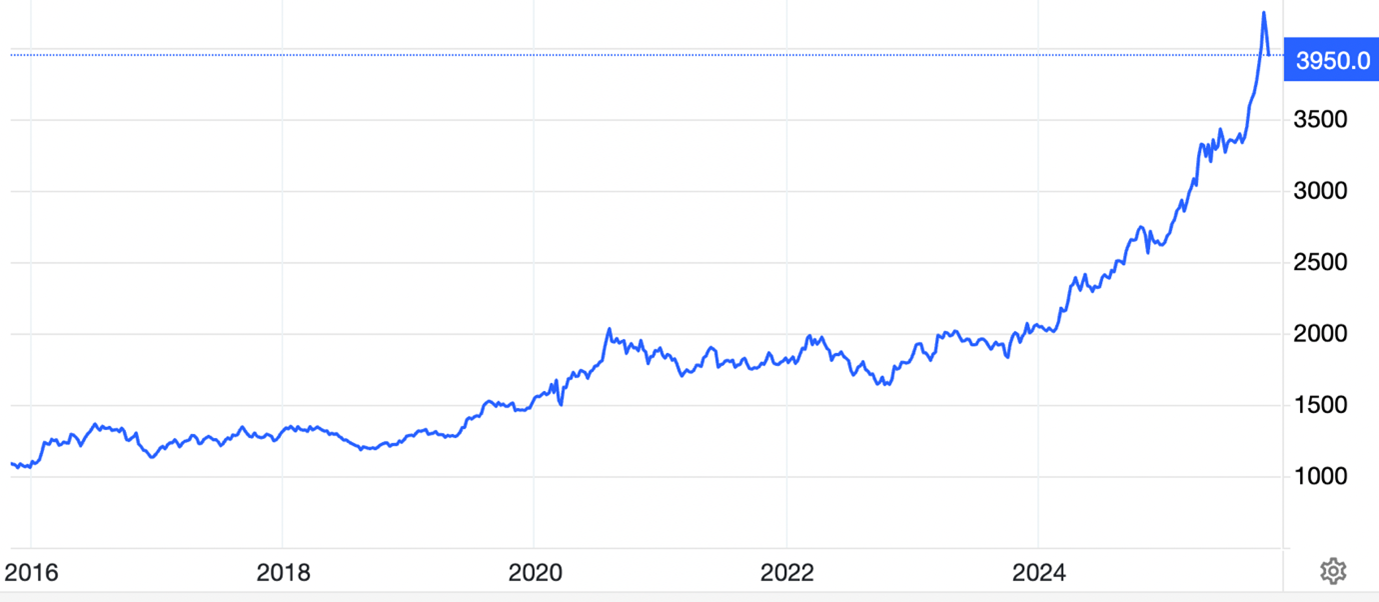
Source: Trading Economic: to 30 October 2025.
Gold equities, however, have badly lagged gold-price gains over the past 20 years, primarily due to poor operating performance as rising energy, labour and project costs squeezed gold-producer margins and earnings.
Another sector headwind was value-destroying acquisitions across the global gold sector and insufficient focus on returning excess shareholder capital.
PM Capital had limited exposure to gold companies in the past decade for these reasons. We were concerned by poor capital allocation and management in the gold sector, and preferred copper and other commodity producers – a strategy that contributed to our portfolio’s outperformance over the past decade.9
Disconnect between gold equities and gold price
Our view on gold equities changed in late 2023 for two reasons. First, the disconnect between the rising gold price and gold company valuations became extreme. As more investors focused on physical gold, gold equities were relatively overlooked, despite their earnings leverage to a higher gold price.
Chart 3 below shows the two lost decades for global gold companies. It compares the MSCI ACWI IMI Gold Index (USD), which comprises 76 of the world’s largest gold companies10, to the MSCI ACWI IMI Index (global equities).
Note how gold equities (the bottom blue line in the chart) have underperformed global equities (the yellow line) since September 2010. Also note how gold equities, after rallying this year, are only just back to 2011 prices.
Chart 3: Gold equities versus global equities
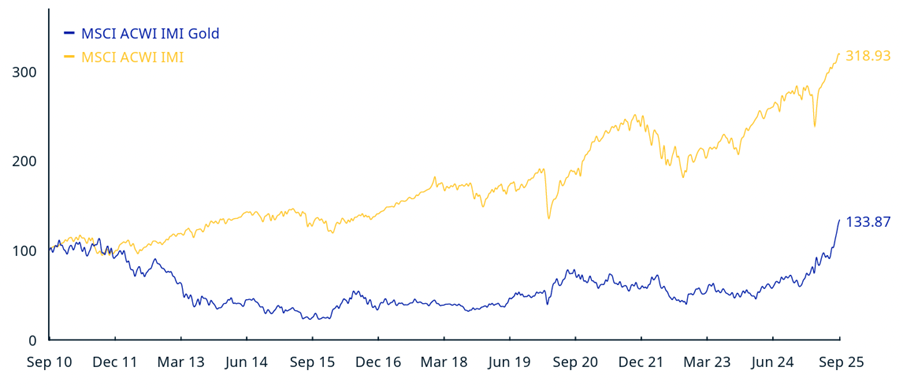
Source: MSCI ACWI IMI Gold Index (USD). Cumulative index performance – price returns – September 2020 to September 2025.
Remarkably, since 2007, gold equities have returned just 4.1% annualised11. Although recent gains have impressed – the gold equities index rose 91.5% over the year to 30 September 202512 – the sector’s long-term performance is poor.
We believe the gap between the performance of gold equities and the gold spot price, and also with global equities, could continue to narrow over the coming decade, albeit with pullbacks and corrections along the way given global economic uncertainty. No sector recovery occurs in a straight line.
Improving operational performance
The second reason for our interest in gold equities was signs of improving operational performance in some gold producers.
A feature of our investment style is identifying assets the market misunderstands, ignores or overlooks – and buying them when they trade at a bottom-quartile valuation relative to their historic valuation parameters. We search for the highest-quality, best-value companies exposed to these themes.
That was the case with Newmont Corporation when we bought it in late 2023. The world’s largest gold producer, by resources and reserves13, had badly underperformed the gold price for two decades, as Chart 4 below shows.
Chart 4: Newmont versus gold price – significant underperformance
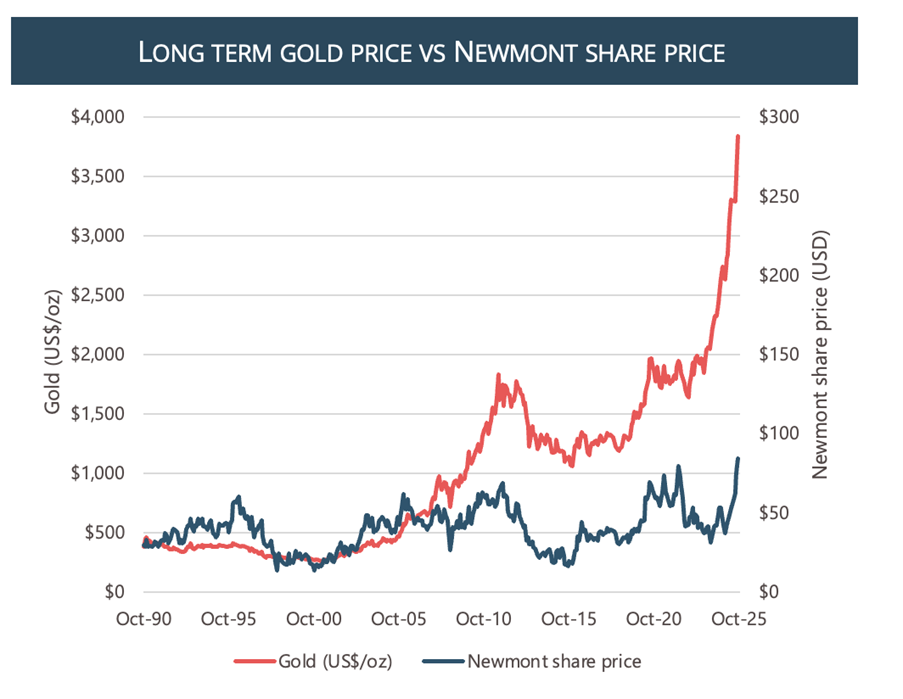
Source: Factset, PM Capital
At the time, Newmont was out of favour due to market concerns about operational issues at some of its mines, rising costs and fears of dividend cuts.
Newmont’s aggressive acquisition strategy, culminating in the May 2023 acquisition of Newcrest Mining in Australia, also concerned the market.
We believed the market over-reacted to Newmont’s challenges. For all its near-term challenges and following the Newcrest acquisition, Newmont would own over half of the world’s tier-1 gold mines, along with a significant copper contribution, a base metal PM Capital favours.
We expected short-term problems at Newmont’s US and Mexican mines to moderate and its operating performance to improve over the next few years, potentially aiding its margins and earnings, and distributions to investors.
We appreciated Newmont’s strategy to switch from significant internal capital expenditure to realising operational synergies, selling non-tier-1 assets and returning excess capital to shareholders through share buybacks and dividends. If that occurred, a re-rating of Newmont’s valuation was possible.
Newmont shares have rallied 65% year-to-date, as Chart 5 below shows. In late October 2025, Newmont announced solid third-quarter earnings as the higher spot gold price and lower unit cash costs offset its lower sales volume.14
Newmont’s share price fell on the news, amid the broader sell-off in gold equities, but remains sharply higher this year.
Chart 5: Newmont Corporation (ASX: NCM) share price
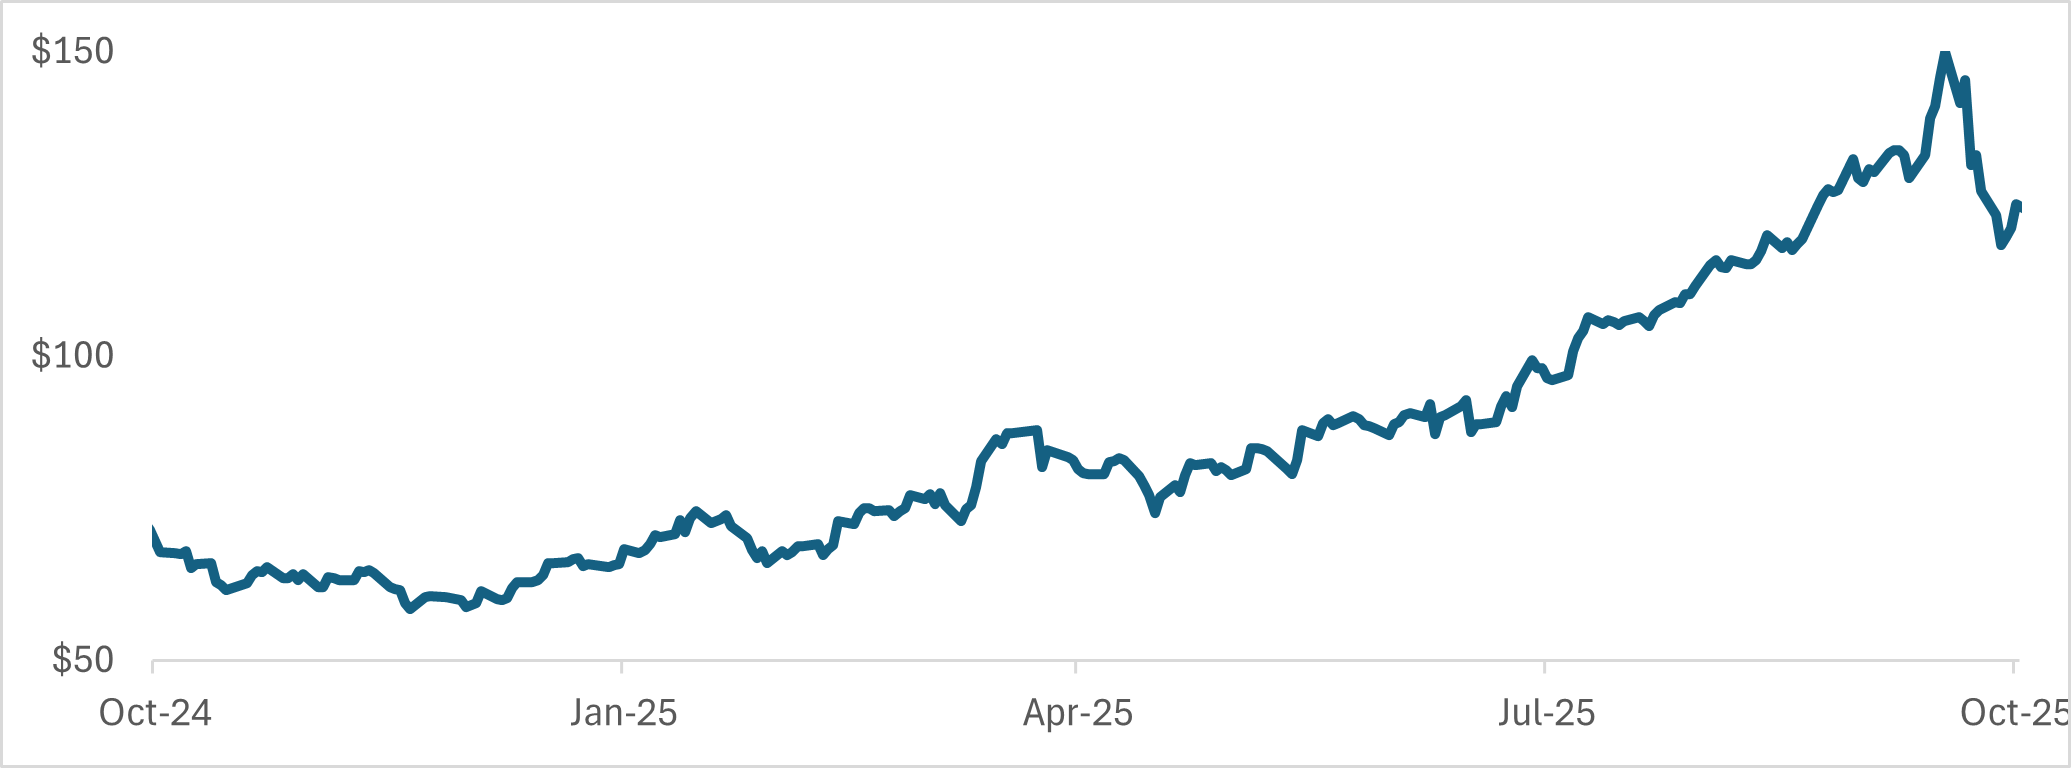
Source: Bloomberg as at 31 October 2025
In July 2025, PM Capital added Northern Star Resources to its Global Companies Fund and Australian Companies Fund.
Northern Star is one of the world’s leading gold producers with operating mines and exploration programs in Western Australia and Alaska. The company sold 1.6 million ounces of gold in FY25.15
The Northern Star investment opportunity was akin to Newmont - Northern Star had lagged gains in the physical gold price and faced operational challenges. In April 2025, Northern Star downgraded its production guidance and increased its cost guidance for FY25.16
Similarly to Newmont, Northern Star had also made a substantial acquisition, acquiring De Grey Mining in May 2025 and giving Northern Star full control of the world-class Hemi gold project in Western Australia’s Pilbara region.
The combination of an equity dilutive acquisition and operational challenges saw Northern Star’s valuation fall by almost a third over the next three months.17 We took advantage of this volatility to initiate a position in Northern Star at what we believed was a bottom-quartile valuation.
Like Newmont, we thought Northern Star could overcome its short-term operational challenges, benefit from a higher spot gold price while delivering a substantial increase in production from two top-tier projects this decade.
Chart 6: Northern Star share price (ASX: NST)
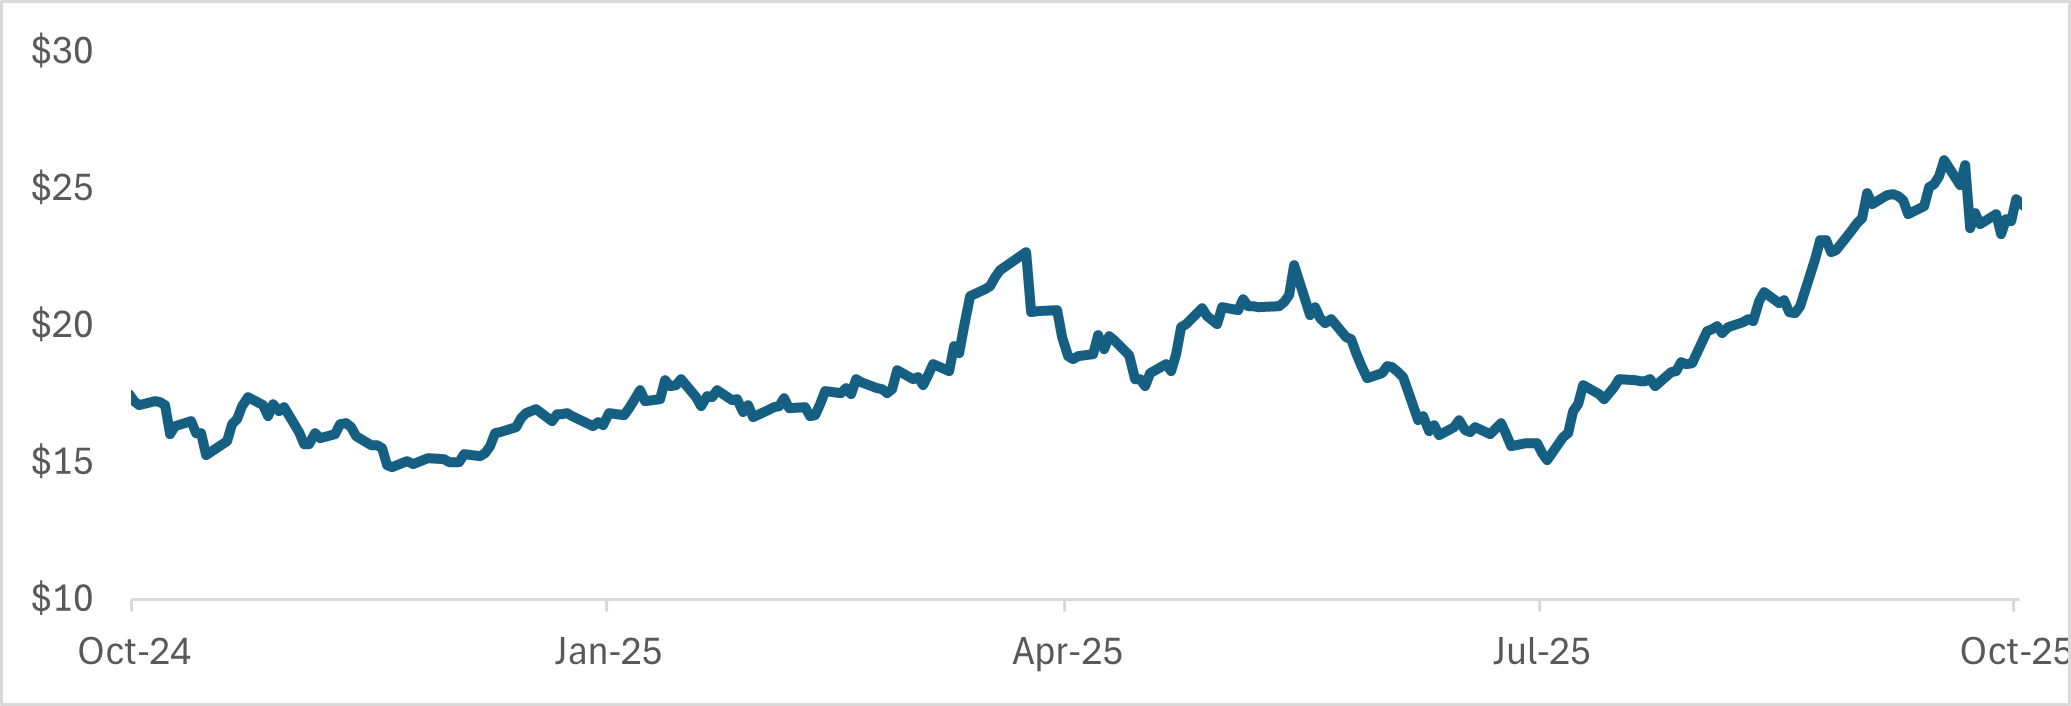
Source: Bloomberg as at 31 October 2025
Conclusion
PM Capital’s exposure to gold producers reinforces our approach to identify powerful long-term investment themes and valuation anomalies within those themes.
We believed the extent of the disconnect between the performance of physical gold and gold equities was irrational. Also, that a gold equities recovery may be in its infancy after two decades of underperformance.
As other investors bought physical gold, we preferred undervalued gold producers that provided lower-risk exposure to the gold theme, in our view.
We also sought high-quality gold producers the market misunderstood or had become excessively bearish towards.
Our positions in Newmont and Northern Star are not predicated on further gains in the gold price from here. Both companies could potentially be re-rated on their potential to increase production, margins and earnings at the current spot gold price – and return excess capital to shareholders.
That said, a recovery in select gold producers could take years or decades to play out fully, as they move from bottom- to top-quartile valuations over a long investment cycle.
Exploiting this opportunity will require discipline, patience, conviction and a long-term mindset. We expect the spot gold price, and thus gold equity valuations, to remain volatile given elevated global uncertainty – a condition that suits PM Capital’s active investment style.
- More PM Capital Insights are available here.
- To learn about PM Capital’s Global Companies Fund, visit our Fund page.
1 Refers to PM Capital’s Global Companies Fund. The Fund returned 10% in the three months to 30 September 2025. See the PM Capital Quarterly Report September for more information on Fund performance. Past performance is no guarantee of future performance.
2 To 30 September 2025.
3 Refers to the price of gold bullion in USD gold price. Source: Trading Economics.
4 Freeport-McMoRan FCX 3rd Quarter Supplemental Financial Data. Presentation. 23 October 2025, P.6.
5 Source Trading Economics. Refers to change in USD gold price from 20 October 2025 to 30 October 2025.
6 See The Guardian, ‘Why thousands are queuing for hours in central Sydney to buy gold’. 22 October 2025. https://www.theguardian.com/business/2025/oct/22/gold-price-australia-t…
7 Gold was US$1,950 an ounce on 2 January 2023. It was US$3,946 an ounce on 30 October 2025. Source: Trading Economics.
8 See, ‘Interest rate rises to quicken rotation from growth to value stocks’, 7 February 2022. https://www.pmcapital.com.au/insight/brace-higher-inflation
9 Refers to PM Capital’s Global Companies Fund. 10-year returns to 30 September 2025. See the PM Capital Quarterly Report September for more information on performance. Past performance is no guarantee of future performance.
10 Source: MSCI Index Factsheet for MSCI ACWI IMI Gold Index (USD). September 30, 2025.
11 Refers to period from 31 May 2007 to 30 September 2025. For MSCI ACWI IMI Gold Index (USD). Refers to price returns. Source: MSCI Index Factsheet for MSCI ACWI IMI Gold Index (USD). September 30, 2025.
12 To 30 September 2024. Source: MSCI Index Factsheet for MSCI ACWI IMI Gold Index (USD). September 30, 2025.
13 Newmont Reports 2024 Mineral Reserves of 134.1 Million Gold Ounces and 13.5 Million Tonnes of Copper. 20 February 2025. Source: Newmont Corporation. https://operations.newmont.com/reserves-and-resources
14 Newmont Reports Third Quarter 2025 Results and Improves 2025 Cost & Capital Guidance, Source: Newmont Corporation. 23 October 2025.
15 Results Presentation for Year Ended 30 June 2025. Source. Northern Star Resources. 21 August 2025, P.3.
16 Quarterly Activities Report, March 2025. Northern Star Resources. 29 April 2025.
17 Refers to period from 22 April 2025 to 1 August 2025. Based on Northern Sta share price.
Disclaimer:
This information is issued by PM Capital Pty Limited (ACN 637 448 072) (‘PM Capital’), a corporate authorised representative of Regal Partners (RE) Limited (ACN 083 644 731, AFSL 230222) (‘Regal Partners RE’). Regal Partners RE is the Responsible Entity and issuer of PM Capital Global Companies Fund (ARSN 092 434 618) and has authorised the release of this information. PM Capital and Regal Partners RE are wholly owned subsidiaries of Regal Partners Limited (ACN 129 188 450, ASX:RPL) (‘RPL’) (RPL and its subsidiaries are referred to together as ‘Regal Partners’). PM Capital’s Financial Services Guide can be found on RPL’s website or is available upon request.
This information is subject to copyright and any use or copying of the information in it is unauthorised and strictly prohibited.
Past performance is not indicative of future performance. All investments contain risk and may lose value. The objective and past returns of PM Capital Global Companies Fund (ARSN 092 434 618) are expressed after the deduction of fees and before taxation. The objective is not intended to be a forecast and is only an indication of what the investment strategy aims to achieve over the medium to long term. While we aim to achieve the objective, the objective and returns may not be achieved and are not guaranteed. Certain statements in this information may constitute forward looking statements. Such forward looking statements involve known and unknown risks, uncertainties, assumptions and other important factors, many of which are beyond the control of Regal Partners, and which may cause actual results, performance or achievements to differ materially (and adversely) from those expressed or implied by such statements.
This information has been prepared for general information purposes only and without taking into account any recipient’s investment objectives, financial situation or particular circumstances (including financial and taxation position). The information does not (and does not intend to) contain a recommendation or statement of opinion intended to be investment advice or to influence a decision to deal with any financial product, nor does it constitute an offer, invitation, solicitation or commitment by Regal Partners. You should consider the product disclosure statement (‘PDS’), prior to making any investment decisions. The PDS and target market determination (‘TMD’) can be obtained by visiting our website, www.pmcapital.com.au. If you require financial advice that takes into account your personal objectives, financial situation or needs, you should consult your licensed or authorised financial adviser. This information is only as current as the date indicated, is subject to change without notice and may be superseded by subsequent market events or for other reasons. Regal Partners does not guarantee the performance of any fund or the return of an investor’s capital. None of Regal Partners or its related parties, employees or directors provide any warranty of accuracy or reliability in relation to this information and to the extent permitted by law, Regal Partners disclaims all liability (including liability for negligence) for direct or indirect loss or damage suffered by any recipient acting in reliance on this information.