
'Banking on a recovery in Europe' is one of five of PM Capital's current key investment themes
By John Whelan, Co-Portfolio Manager - Equities
Introduction
By sector, banks are the largest allocation in the PM Capital Global Companies Fund, accounting for 32% of the portfolio.1 Bank of America, Wells Fargo & Company and ING Groep are in the Fund’s top-10 holdings.2
PM Capital has had a long-held position in US bank stocks. In 2020 and 2021, we increased our position in European bank stocks during market weakness. The Fund's overall weighting in European bank stocks is 18%3
European and UK bank holdings in the Fund include ING (The Netherlands) Lloyds Banking Group plc (UK), Bank of Ireland and Caixabank (Spain).4 The latter three banks have negligible direct exposure to the Russian economy.
ING’s direct exposure to Russia and Ukraine is less than 1% of its assets, but it has just over 10% in terms of its equity capital. Although this exposure is material, ING has excess capital on its balance sheet to cover a 100% write-down of these assets (a 100% write-down would be extreme, even in a worst-case scenario).
European banks still trade at bottom-quartile valuations. They have underperformed banks in the US and Australia partly because interest rates in Europe fell further, even turning negative in parts of Europe. German 10-year bonds, for example, were negative since early 2019 before turning positive in February 2022.
In our view, European bank stocks are the most undervalued sector in global equity markets today. Chart 1 highlights the relative underperformance of European banks.
Chart 1: Lessons of a lifetime: European banks have struggled relative to the market...
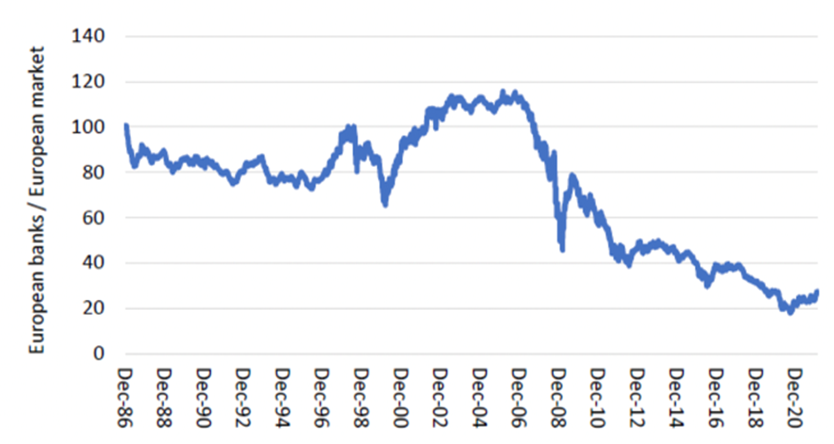
Source: Bloomberg, UBS
Inflation, rates and banks
Russia’s invasion of Ukraine in February 2022 has created uncertainty for the Eurozone economy. This could delay the timing of interest rate rises in Europe, but PM Capital retains its positive view on European banks. The sector’s long-term growth drivers – economic growth, inflation and easing regulation – remain firmly in place.
Our conviction towards European banks – and global bank stocks generally – has been strengthened by changes this year in inflation and interest-rate expectations.
For the past 12 months, PM Capital has consistently argued that banks and commodity producers are the most attractive sectors as the world enters an inflexion point in inflation and interest rates. After 40 years of falling government bond yields, the tide is turning, as Chart 2 below shows.
Chart 2: Global government bond yields at record lows
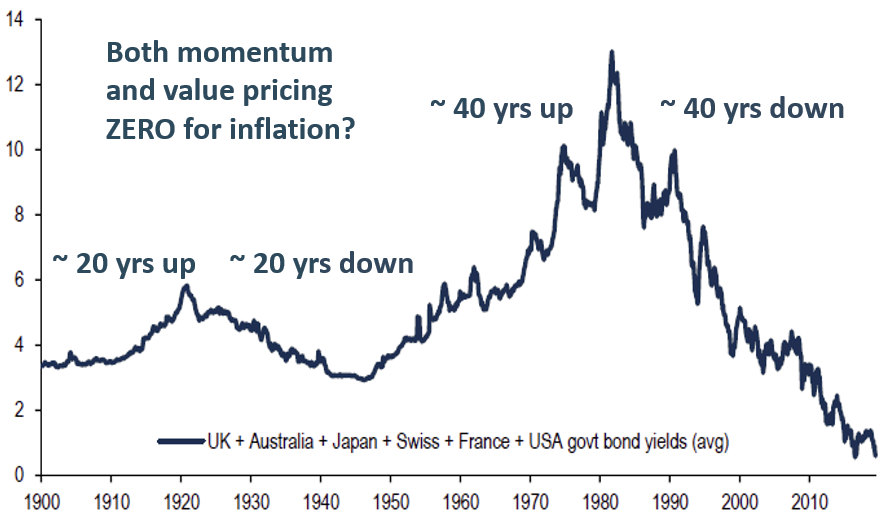
Source: BofA Merrill Lynch Global Investment Strategy, Bloomberg, Global Financial Data. Chart show simple average 10 year yield.
PM Capital believed that inflation would be more persistent than the market realised and disputed the view that an inflation spike was solely a temporary result of COVID-19-induced supply-chain bottlenecks. Sharply higher inflation data this year confirms our view.
Rising inflation forces central banks to lift rates to slow demand. On balance, higher rates are good for banks. Rising rates point to a strengthening economy, which boosts credit demand. Also, as rates rise, bank net interest margins expand (the amount a bank earns on loans compared to the amount it pays on deposits). That aids bank earnings.
The US Federal Reserve and the European Central Bank this year acknowledged that rates would rise. Market forecasters like Goldman Sachs, a US investment bank, believe the US Fed will hike rates seven times in 2022 – for a combined 175 basis points.5
Clearly, the headwind for bank stocks over the past few years – record-low inflation and interest rates – is turning and becoming a tailwind. That could potentially underpin outperformance of global banks stocks this decade and a re-rating of European bank stocks.
However, there are two caveats to that view. First, PM Capital believes global equity returns will be more constrained this decade. Large gains from 2020 and 2021, when equity markets recovered from the COVID-19 shock, will not repeat anytime soon.
Second, sector recoveries take years to play out, as Chart 3 below shows. The top half of the chart shows how the rally in tech stocks took almost a decade to unfold. The bottom half shows the underperformance of financial stocks that lasted just over a decade.
Investors who want to benefit from a potential recovery in European bank stocks will need patience. As PM Capital has said many times, investment cycles typically take 7-10 years to play out. A recurring trap is selling out of sector recoveries too early.
Chart 3: Sector performance
S&P Tech relative performance vs S&P 500
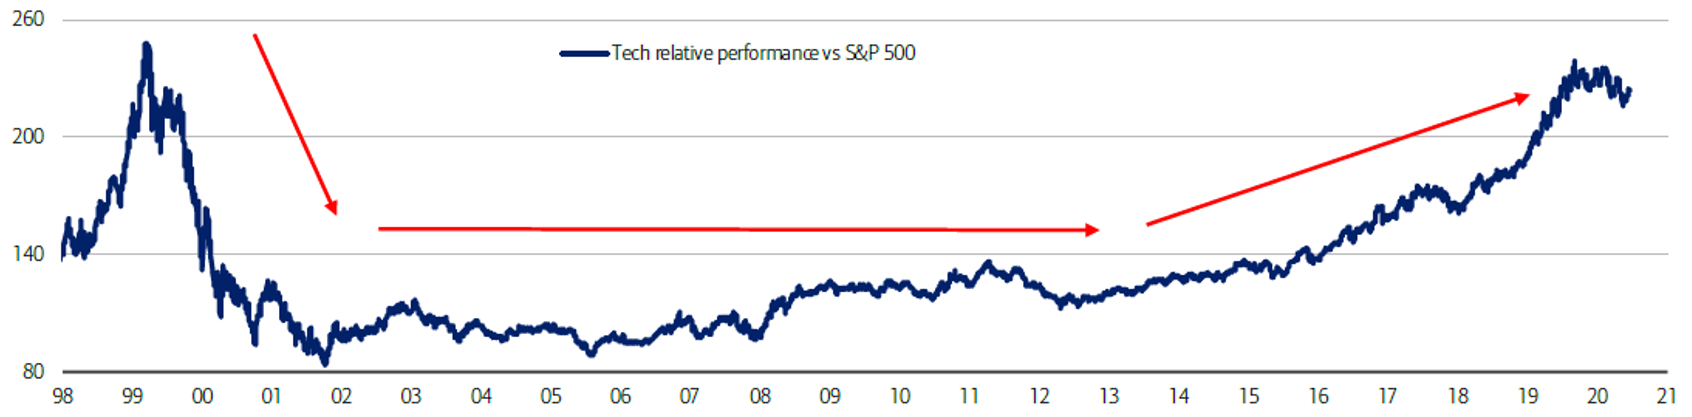
S&P Financials relative performance vs S&P 500
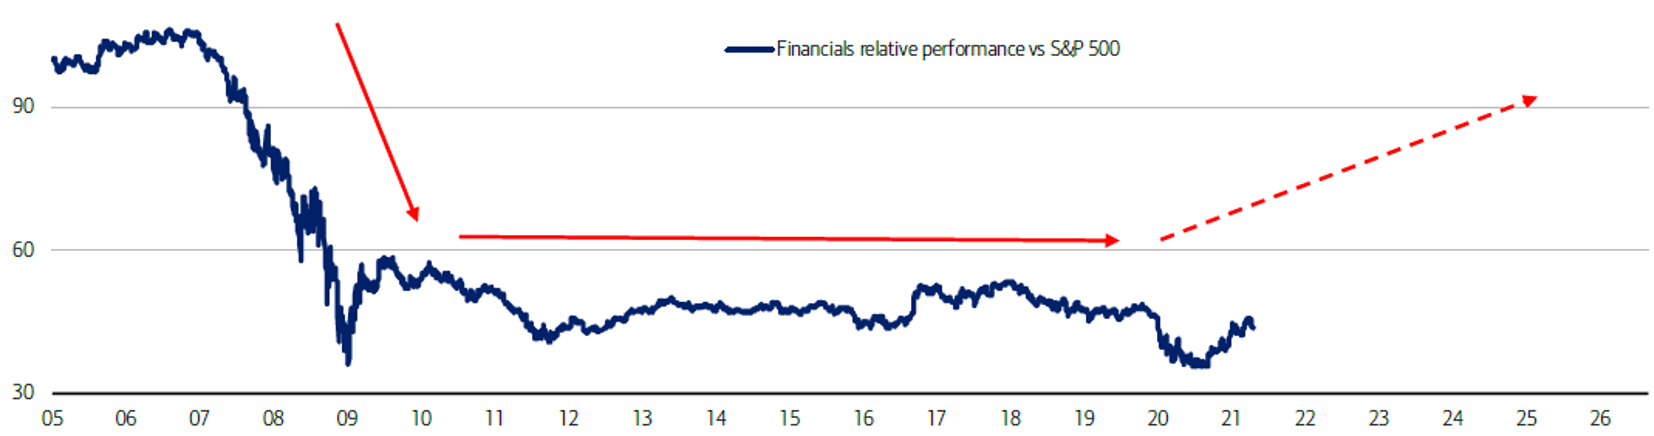
Source: BofA US Equity & Quant Strategy, Bloomberg
4 reasons we own European banks
1. Earnings recovery
In June 2014, the European Central Bank (ECB) introduced its Negative Interest Rate Policy (NIRP) to boost the region’s fragile economy. By September 2019, the deposit rate in Europe was -0.5%.6 In March 2020, the German 10-year bond hit -0.91%.7
In June 2021, markets expected European interest rates to stay negative for at least five years.8 Low rates depressed European bank earnings. Expectations that rates would stay negative for years weighed on sentiment and led to bank underperformance.
Simply, the market was too bearish on Europe’s rate outlook and bank valuations. That created an opportunity for PM Capital to buy European banks at attractive prices.
European banks are strongly leveraged to rising interest rates. UBS, an investment bank, expects European interest rates to increase by 150 basis points by 2024.9 UBS analysis shows a 100-basis points rise equates to a 20% increase in bank earnings.10
This could be even higher for some European banks. In a conference call with analysts, Caxibank said a 100 basis-points rise in European rates would expand its Net Interest Margin by 20-25% (which flows straight through to the bank’s earnings).11
In our view, Europe is on the cusp of rising bank earnings over the next few years. That could be a catalyst for a larger re-rating of the region’s banking sector.
2. COVID-19 provisioning
European banks followed the global trend with heavy provisioning for bad and doubtful debts during COVID-19. Regulators require banks to make provisions for future non-performing loans. When banks expect such loans to increase, they set aside more funds, and vice versa.
The level of bank provisions affects their profits, balance sheet and capital position. New provisions are raised through a ‘charge for bad and doubtful debts’, which is recorded as an expense on the income statement. That reduces bank profits.
Actual loan losses during COVID-19 were less than feared. US banks started releasing their provisions and European banks began to do the same in 2021. Eight of the 25 largest European banks released provisions in the first quarter of 2021.12 Lloyds Banking Group, in our portfolio, released the highest provisions of those banks.13
In its annual risk assessment of European banks, the European Banking Authority in December 2021 reported improvements in bank solvency, profitability and liquidity. It said fears about potential asset-quality deterioration had mostly not materialised.14
As European economies recover – and the risk of non-performing loans reduces – European banks will likely reverse more provisions. That could be another tailwind for European bank earnings growth and coincide with expanding net interest margins as rates in the region increase.
3. Excess capital
As COVID-19 erupted in 2020, the European Central Bank sought to safeguard the banks’ capacity to absorb loan losses and support the eurozone economy.
In December 2020, the ECB called on banks to refrain from, or limit, dividends until September 2021.15 The ECB also called on European banks not to conduct (or to limit) share buybacks. European banks faced tighter regulation than their US peers.
However, the requirement for European banks to hold more capital during the pandemic has paved the way for dividend increases and share buybacks to resume.
For example, ING announced a 0.62 (€) total dividend in 2021, up from 0.39(€) in 2020.16 In October 2021, ING announced a €1.7 billion share buyback program.17 PM Capital believes ING’s expected yield and its buyback program will result in a double-digit total yield.
If our expectations of higher yield prove correct, some European banks could deliver an a very attractive total return (including capital growth) over coming years.
4. Valuations
The MSCI European Banks index, a barometer of 27 large- and mid-cap European banks, rose 38.7% in 2021. The index was down 2.9% year-to-date in a volatile period for European and global equities due to Russia's invasion of Ukraine (the MSCI Europe Index was down 6.11% year-to-date).18
Although recent European bank gains impress, they are off a low base. As Chart 4 below shows, European banks (the blue line) have underperformed European equities (yellow line) since 2008. PM Capital expects this performance gap to close this decade.
Chart 4: Cumulative Index performance (net returns EUR)
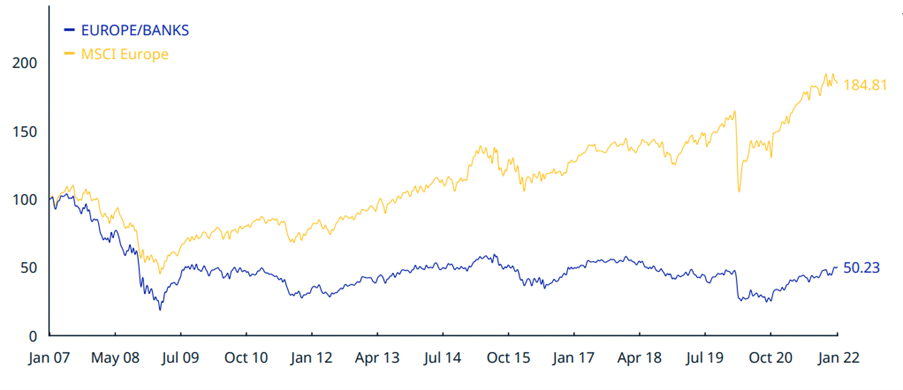
Source: MSCI
At a stock level, adjusting for excess capital, ING trades on an adjusted forward Price Earnings ratio of about 5 times according to our analysis. By comparison, Commonwealth Bank trades on a forward PE of almost 19 times. ING’s price-to-book ratio is 0.8 times; CBA’s is 2 times.19
European banks also look undervalued compared to US banks. In February 2022, European banks in aggregate traded on about 7 times forward earnings, according to our estimates. US banks had re-rated to 11 times earnings, our analysis shows. We expect that gap to contract in the next few years.
| Back to our 5 current themes | Managed Funds | Contact Us | Subscribe to our insights |
Notes and References
1 At 28 February 2022. Refers to weighting of Domestic Banking - Europe, and Domestic Banking - USA.
2 At 28 February 2022.
3 At 28 February 2022.
4 ibid
5 Curran, E (2022), “Goldman sees Fed hiking seven times in 2022 instead of five,” Bloomberg. 11 February 2022. https://www.bloomberg.com/news/articles/2022-02-11/goldman-sachs-now-predicts-fed-to-hike-seven-times-in-2022.
6 European Parliament (2021), “What are the effects of the ECB’s negative interest rate policy?” Monetary Dialogue Papers. June 2021. https://www.europarl.europa.eu/cmsdata/235691/02.%20BRUEGEL_formatted.pdf
7 Bloomberg, “German Yields cross zero threshold as bond selloff intensifies.” https://www.bloomberg.com/news/articles/2022-01-19/german-10-year-yield-turns-positive-for-first-time-since-2019
8 European Parliament (2021), “What are the effects of the ECB’s negative interest rate policy?” Monetary Dialogue Papers. June 2021.
9 UBS (2022), “European Banks”. Global Banking Research. 8 February 2022
10 Ibid. Bank earnings defined as Profit Before Tax.
11 Depending on Caxiabank’s assumption. Q4 2021 Conference call for Caxiabank.
12 S&P Global, (2021). “Most European banks expected to hold on to loan loss provisions in Q2). 1 July 2021. https://www.spglobal.com/marketintelligence/en/news-insights/latest-new…;
13 Ibid
14 European Banking Authority (2021), European Banking Risk Assessment,” 3 December 2021. https://www.eba.europa.eu/eba-risk-assessment-shows-improvements-eu-ban…
15 European Central Bank, December 2020. ‘ECB asks banks to refrain from or limit dividends until September 2021,’ Press Release.
16 ING Dividend and Distribution History. At 18 February 2022. https://www.ing.com/Investor-relations/Share-information/Dividend-and-d…;
17 ING media release. 1 October 2022. https://www.ing.com/Newsroom/News/Press-releases/ING-announces-1.7-bill…
18 MSCI, (2022), “MSCI European Banks Index,” 31 January 2022. https://www.msci.com/documents/10199/e72ea9be-ae79-4bb5-8ce0-054d4f371549#:~:text=The%20MSCI%20Europe%20Banks%20Index,Classification%20Standard%20(GICS%C2%AE).
19 As at 18 February 2022.
This Insight is issued by PM Capital Limited ABN 69 083 644 731 AFSL 230222 as responsible entity for the PM Capital Global Companies Fund (ARSN 092 434 618, the ‘Fund’). It contains summary information only to provide an insight into how we make our investment decisions. This information does not constitute advice or a recommendation, and is subject to change without notice. It does not take into account the objectives, financial situation or needs of any investor which should be considered before investing. Investors should consider the Target Market Determinations and the current Product Disclosure Statement (which are available from us), and obtain their own financial advice, prior to making an investment. The PDS explains how the Fund’s Net Asset Value is calculated. Past performance is not a reliable guide to future performance and the capital and income of any investment may go down as well as up.
See www.pmcapital.com.au/global-companies-fund/performance for standard reporting periods. The investment objective is not a forecast, and is only an indication of what the investment strategy aims to achieve over the medium to long term. Returns are calculated from exit price to exit price assuming the reinvestment of distributions for the period as stated and represent the combined income and capital return. The Index is MSCI World Net Total Return Index (AUD). See www.msci.com for further information.