'As copper climbs, oil appeals' is one of five of PM Capital's current key investment themes
By Kevin Bertoli, Co-Portfolio Manager - Equities
“The easy copper deposits have been found over the years. Modern deposits at the surface are of much lower grade and require tremendous investment in infrastructure, mining and processing. Increasingly, mines are underground where costs are greater.”
- Richard Adkerson, CEO Freeport-McMoRan1
“Investors should not fund new oil, gas and coal supply projects if the world wants to reach net-zero emissions by mid-century, the International Energy Agency said.”
- Reuters report (May 2021)2
Introduction
As a leading long-term value investor, PM Capital is known for investing significant capital in sectors of the market that are often deeply out-of-favour with investors.
Over the last 25 years, we have observed that opportunities emerge when an impatient and often short-sighted equities market misreads an industry’s longer-term outlook when investors extrapolate the recent past.
One such opportunity emerged in late 2018 when commodity companies traded in the bottom quartile of their long-term valuation range and were shunned for more popular growth stocks.
PM Capital identified copper as a particularly attractive segment of the commodities industry and initiated a position in several tier-one global producers.
In 2020, we added to our copper position during heightened market volatility caused by the COVID-19 pandemic, which had created a once-in-a-generation opportunity to buy commodities.
Our core copper investments – Freeport-McMoRan, First Quantum Minerals and OZ Minerals – have outperformed meaningfully over the past three years. Freeport-McMoRan has rallied almost eightfold since the March 2020 low in global equities.3
Chart 1: Freeport-McMoRan
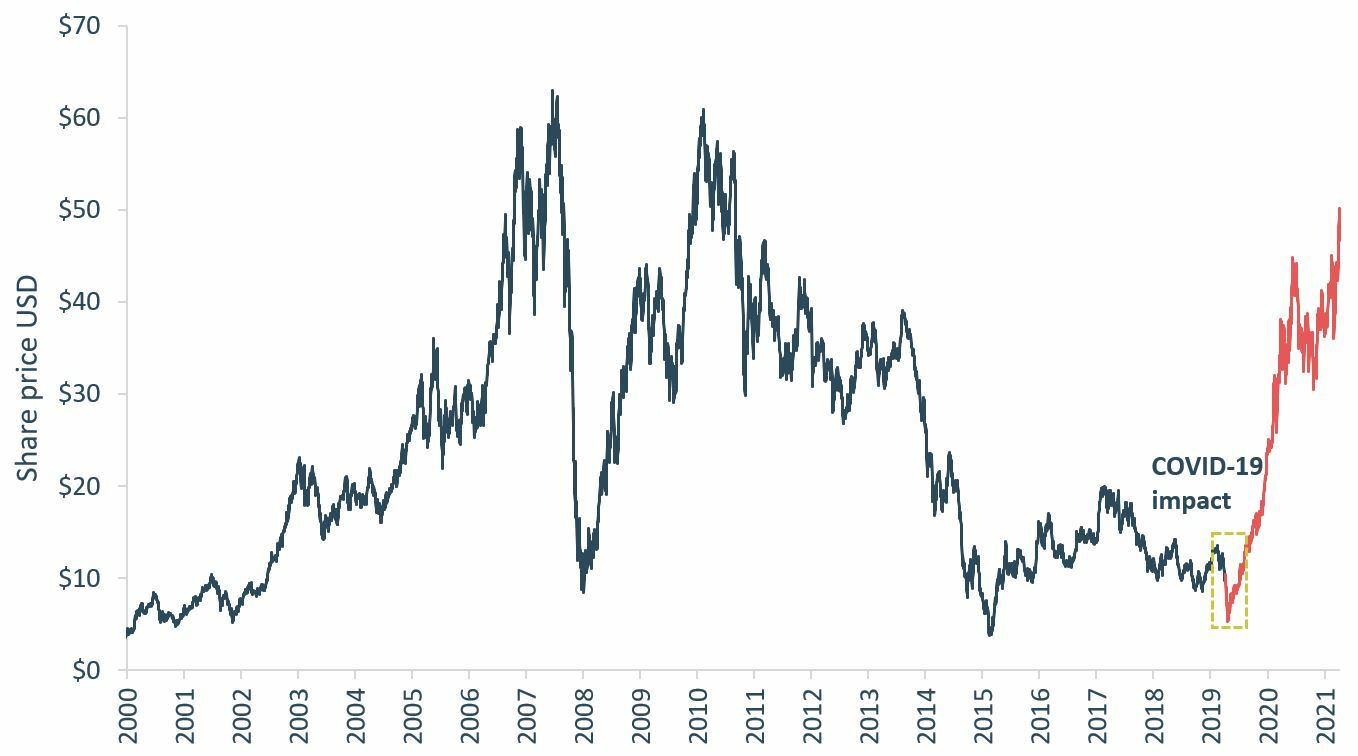
Source: Bloomberg
Although PM Capital remains constructive on copper’s long-term fundamentals and retains a position in its core holdings, we began reducing our exposure last year after the significant share price re-rating witnessed across the sector. Put frankly, valuations in the sector are no longer the extreme anomalies they once were.
Having realised gains in copper, we rotated our commodities exposure into energy stocks. Our core positions include Shell plc (previously known as Royal Dutch Shell) which was first purchased in 2020 as well as Chinese National Offshore Oil Corporation (CNOOC) and Woodside Petroleum.
Our copper and oil positions have several interesting parallels. Firstly, the initial observation that both sectors traded at bottom-quartile valuations drove the decision to investigate each sector in greater depth.4
Secondly, our investment thesis for each commodity was supported by a positive view of long-term supply dynamics. We believed the market underestimated long-term supply constraints in copper and oil and the impact this would have on their price (our views on copper and oil supply are outlined in more detail below).
While it’s too soon to know if our energy holdings will deliver similar returns to those in copper, early returns have been positive with geopolitical concerns pulling forward supply risks and refocusing investors’ attention on the issue. Energy has been among the best-performing sectors year to date. Through February 2022, the S&P 500 energy sector returned 23% compared to the wider market declining -8%.5 Over 12 months to end-February 2022, their return was 46.5%.6 While energy has outperformed with a backdrop of structurally higher oil and gas price we believe the sector rotation is still in the very early stages. Energy accounts for small percentage of investor portfolios, at the end of December 2021, the energy component of the S&P 500 was at a record low of only 2.67%.7Positive view on copper
In 2018, fears of slowing Chinese economic growth and an intensifying trade war between China and the United States (under the Trump Presidency) weighed on commodity prices. China is the largest consumer of most industrial metals.
Also, as capital flowed into new-economy stocks, such as the FAANG companies, commodity stocks underperformed. The result: commodity producers had never been cheaper relative to the market in almost 100 years, as Chart 2 below shows.
Chart 2:
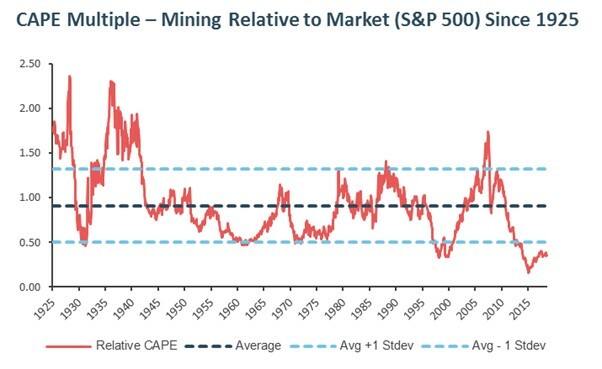
Source: Bernstein. CAPE stands for Cyclically Adjusted Price Earnings ratio
Market sentiment towards copper was especially bearish, in large part because China accounts for about 50% of the metal’s demand. There were record short positions against copper (investors betting on the price to fall) and the copper price was nearing its marginal cost of production.
Investor perception, however, was in stark contrast to the commentary from commodity producers. They were openly bullish about copper’s long-term fundamentals with the emergence of new demand drivers (renewables and electric vehicles) central to their bullish thesis.
PM Capital spent the better part of six months looking closely at copper market and concluded while renewable energy and electric vehicles were attractive new markets, challenges on the supply side were poised to be an even greater threat.
Our research indicated that the likelihood supply lagged demand over the next decade was high. Firstly, grades at existing copper mines were falling fast. According to Wood McKenzie, grades across the industry had fallen 25% over the past two decades, which meant it was costing more money to pull the same amount of copper out the ground.
Secondly, there had been no new discoveries of large copper deposits (so-called mega deposits) in decades. These were required to offset the natural decline in existing supply.
Thirdly, it was taking more time and money to bring new supply to market as geology became more difficult and environment permitting more rigorous.
When we began our analysis, the spot price (for immediate settlement) of copper was US$2.50 per pound. We believed the long-term copper price needed to be more than US$3.50 per pound to incentivise new production and increase copper supply. Based on this incentive price, copper stocks in 2018 were extremely undervalued in our view.
The pandemic has further exacerbated supply challenges in copper. Peru, the world’s second-largest copper producer, had the largest fall in copper production in its history in 2020.8
As copper supply became more challenged, demand for the metal had improving prospects as governments worldwide looked to revive economic conditions. This has driven copper inventories to near record lows.
Our copper thesis – a higher copper price due to supply constraints and firming short-term demand – proved correct. The copper spot price is now US$4.42 a pound9 – or double the price during our initial analysis in 2018.
The rising copper price sparked a rally in copper producers, as Chart 3 below shows. Freeport-McMoRan, First Quantum Minerals and Oz Minerals have been the best performers among the largest copper producers.
Chart 3: Copper producers
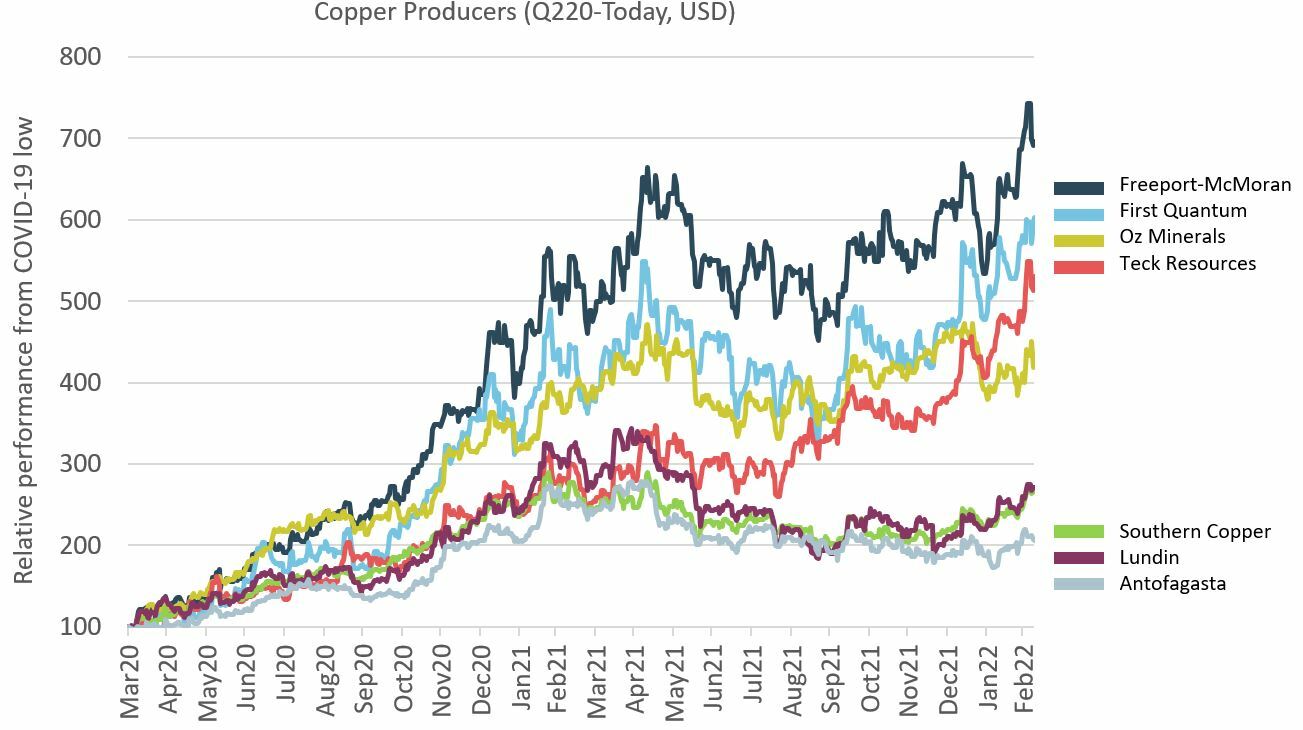
Source: Factset
Foundations for higher oil prices
Like copper, the oil market was hard hit during the pandemic. Oil demand plunged as governments worldwide shuttered their economies to prevent the spread of COVID-19. In April 2020, the International Energy Agency estimated oil demand fell 30% year-on-year – to the lowest level since 1995.10
At the same time, an oil-price war erupted between Russia and Saudi Arabia, the two largest OPEC producers, when they could not reach consensus on oil production. An ensuing oversupply of oil sparked a price collapse: the contract futures price for West Texas Intermediate briefly plummeted from US$18 a barrel to negative US$37 a barrel in April 2020.
The structure of oil contracts exacerbated the sell-off. The contracts are settled in physical oil, meaning investors needed somewhere to store a glut of oil supply.
At the time, there was talk that the oil sector might never recover fully, given the long-term move towards clean energy. Long-term capital allocation to the sector had fallen. As with copper, PM Capital believed unrelenting negativity surrounding the oil and gas industry had created extreme valuations in the sector.
Even more extreme than copper, oil (in 2020) traded below its marginal cost of production. Oil, too, faced significant medium-term supply challenges, but for different reasons to copper.
Although a focus on emissions targets and the subsequent transition to renewable energy and electric vehicles is a favourable tailwind for long-term copper demand, it’s negative for oil, coal, and other fossil fuels.
Also, growing opposition to fossil fuels, one which is coming from multiple fronts, has the potential to exacerbate underinvestment in the oil industry.
Although oil and gas may see reduced demand in the long run, the energy transition story is one which will take decades to unfold, and we risk seeing an undersupplied market in the short to medium term.
In its landmark 2021 report11, the International Energy Agency (IEA) set out more than 400 milestones to guide the global journey to net-zero carbon emission by 2050. Chief among them was no new investment in fossil-fuel supply projects, and no further final investment decisions for new unabated coal plants.
The IEA’s recommendation that the global oil and gas industry stop investing in their traditional upstream businesses – and relocate capital to renewable energy projects – could have profound implications for future oil supply.
The IEA said oil supplies will become increasingly concentrated in a small number of low-cost producers. OPEC’s share of global oil supply will grow from around 37% in recent years to 52% in 205012 – a level above any point in the history of the oil market.
Goehring & Rozencwajg, a firm that invests in natural resources, argues that non-OPEC oil supply will fall further as Western companies curtail investment in new oil projects. A structural gap between oil supply and demand will emerge as early as the fourth quarter of 2022 and non-OPEC oil supply growth will turn negative this decade.
Institutional investors that incorporate Environmental, Social and Governance (ESG) filters in their decisions are also allocating less capital to traditional oil and gas equities, and more to those in renewable energy.
The sector has also attracted the attention of activist investors looking to accelerate the transition away from fossil fuels. In June 2021, Engine No. 1, a small US hedge fund that was supported by giant index funds, successfully waged a battle to install three directors on ExxonMobil’s board. The activist’s goal: to push the energy giant – and ultimately others like it – to reduce its carbon footprint.
Governments, too, are increasing pressure on energy companies. In May 2021, the Hague District Court in The Netherlands ordered Shell to reduce its worldwide carbon-dioxide emissions by 45% to 2030 (compared to 2019 levels).13
Government and investor pressure on oil ‘supermajors’ will exacerbate challenges to maintain their reserve base and production level. Although capital investment from oil supermajors on new projects has surged over the past 20 years, production and reserves have consistently declined, notes Goehring & Rozencwajg.
Taken together, there could be lower oil supply for non-OPEC countries at a time of continued growth in energy demand. In theory, that means a higher oil price, rising oil-company earnings and continued energy-sector outperformance.
While not factored into our thesis, the recent Russia-Ukraine conflict has reinforced the risk of structural supply shortages in the energy markets pulling forward deficits.
Oil prices soared to a 13-year high on fears over Russia’s possible invasion of Ukraine and tightening oil supplies. Brent Crude oil futures traded above US$130 a barrel in early March14, its price up 67% since the start of 2022 (it was about $US78 a barrel then).
Consequently, PM Capital’s energy sector holdings- Shell, CNOOC and Woodside Petroleum have all rallied - as Chart 4 below shows. Despite the year-to-date move, we continue to hold these positions with valuations yet to fully factor in the increasingly favourable demand supply dynamic, in our view.
Chart 4:
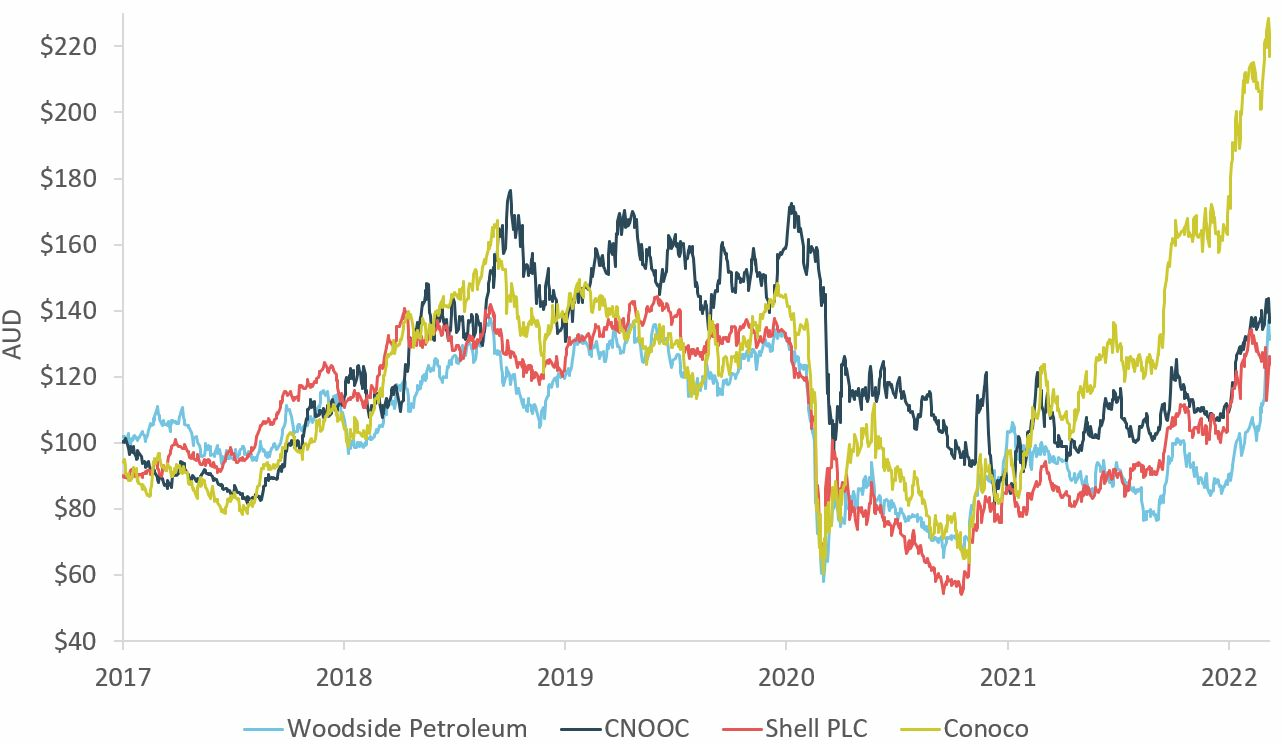
Source: Bloomberg
Conclusion
PM Capital’s rotation from copper to energy stocks reinforces three factors that underpin our investment philosophy:
1. The conviction to buy assets when sentiment is strongly against them and ignore market noise. That is, to go against the investing ‘in-crowd’.
2. The importance of long-term investing and holding stocks through investment cycles that typically take 7 to 10 years to play out. We believe gains in copper and oil could have further to run over the course of this decade.
3. The benefits of buying companies at bottom-quartile valuations and rotating out of them as they approach top-quartile valuations. The ability to realise profits and rotate into undervalued assets is the key to sustained market outperformance over long periods.
| Back to our 5 current themes | Managed Funds | Contact Us | Subscribe to our insights |
Notes and References
1 Freeport-McMoRan, (201), “Q3 2019 earnings call transcript,” 30 September 2019
2 Reuters, “End new oil, gas and coal funding to reach net-zero, says IEA,” May 18, 2021. https://www.reuters.com/business/environment/radical-change-needed-reach-net-zero-emissions-iea-2021-05-18/
3 Freeport-McMoRan (NYSE: FCX) shares were US$5.52 on 20 March 2020. They were US$42.80 on 11 February 2022.
4 Bottom quartile valuation assuming long term commodity prices required to incentivise new greenfield production
5 As measured by the S&P 1200 Energy Companies Index. Source S&P 1200 Energy (Sector). Fact Sheet. February 28 2022. Return is total return (capital growth and dividends). https://www.spglobal.com/marketintelligence/en/news-insights/latest-news-headlines/energy-stocks-survive-market-sell-off-in-january-amid-record-oil-price-rally-68760809
6 Ibid. Returns to end-February 2022
7 U.S. Stock Market Sector Weightings. https://siblisresearch.com/data/us-sector-weightings/
8 Mining Technology, (2022), “After witnessing the highest fall in history due to the COVID-19 pandemic, copper production in Peru is forecast to rise by 10.4% in 2021,” 9 Feb 2022.
9 At 14 February 2022
10 International Energy Agency, (2020), “Oil Market Report – April 2020). https://www.iea.org/reports/oil-market-report-april-2020
11 International Energy Agency (2021). “Net-zero by 2050: A Roadmap for the Global Energy Sector.” May 2021.
12 Ibid. Press release to accompany IEA report. 18 May 2021. https://www.iea.org/news/pathway-to-critical-and-formidable-goal-of-net-zero-emissions-by-2050-is-narrow-but-brings-huge-benefits
13 Boffey, D. (2021), “Court orders Royal Dutch Shell to cut carbon emissions by 45% by 2030.” The Guardian. 27 May 2021. https://www.theguardian.com/business/2021/may/26/court-orders-royal-dutch-shell-to-cut-carbon-emissions-by-45-by-2030
14 CNBC (2022), “US Crude briefly tops $130 a barrel, a 13-year high,” CNBC. 7 March 2022.
This Insight is issued by PM Capital Limited ABN 69 083 644 731 AFSL 230222 as responsible entity for the PM Capital Global Companies Fund (ARSN 092 434 618, the ‘Fund’). It contains summary information only to provide an insight into how we make our investment decisions. This information does not constitute advice or a recommendation, and is subject to change without notice. It does not take into account the objectives, financial situation or needs of any investor which should be considered before investing. Investors should consider the Target Market Determinations and the current Product Disclosure Statement (which are available from us), and obtain their own financial advice, prior to making an investment. The PDS explains how the Fund’s Net Asset Value is calculated. Past performance is not a reliable guide to future performance and the capital and income of any investment may go down as well as up.
See www.pmcapital.com.au/global-companies-fund/performance for standard reporting periods. The investment objective is not a forecast, and is only an indication of what the investment strategy aims to achieve over the medium to long term. Returns are calculated from exit price to exit price assuming the reinvestment of distributions for the period as stated and represent the combined income and capital return. The Index is MSCI World Net Total Return Index (AUD). See www.msci.com for further information.